
Page 41 - 2024 ANNUAL REPORT FAIR TRADE COMMISSION
P. 41
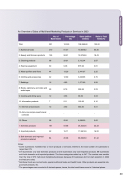
An Overview of Sales of Multi-level Marketing Products or Services in 2023
No. of Businesses
Percentage (%)
Sales (million dollars)
Ratio to Total Sales (%)
Total
331
100.00
108,368.60
100.00
1. Nutritional foods
270
81.57
70,834.82
65.36
2. Beauty and Skincare products
195
58.91
19,976.96
18.43
3. Cleaning products
98
29.61
3,112.04
2.87
4. Exercise equipment
30
9.06
875.92
0.81
�� ����� �������� ��� ������
44
13.29
2,441.97
2.25
6. Clothing and accessories
42
12.69
3,023.65
2.79
7. Beddings
16
4.83
1,071.60
0.99
8. Books, stationery, and video and audio tapes
29
8.76
248.69
0.23
9. Cooking and dining ware
12
3.63
36.52
0.03
10. Information products
7
2.11
103.93
0.10
11. Services and products
12
3.63
553.30
0.51
12. Ash urns and pre-need funeral contracts
-
-
-
-
13. Others
98
29.61
6,089.20
5.62
1. Domestic products
181
54.68
24,202.05
22.33
2. Imported products
52
15.71
17,581.09
16.22
3. Both domestic and imported products marketed
84
25.38
66,562.59
61.42
Notes:
* Some businesses marketed two or more products or services; therefore, the total number of businesses is
larger than 373.
* 204 businesses only sold domestic products and 55 businesses only sold imported products. 88 businesses
sold both domestic and imported products. The three categories added up to 347. The number was smaller than the total of 373 multi-level marketing businesses because 26 businesses did not start operation in 2022 and had zero sales.
* Nutritional foods are normal foods, special nutritional foods and health foods. Other products are essential oils, good luck products, etc.
* The percentages were rounded to 2 decimal spaces; hence, the total could have errors to 2 decimal places.
Important Achievements in 2024
39
